The problem of geographic coordinate system in global scale simulation
Earlier I have discussed some idea about the hexagon-based grid system. Now I have provided some tests and materials to support this project.
90% percent of global maps you can find online are using the geographic coordinate system (GCS). You can try to search “global map” in Google image.
There might be 9% of them are using various map projection. The reason why there are so many different ways to represent the Earth is that Earth is NOT flat. Google know it so they changed the Google Map recently.
So these are some basic GIS knowledge but you can also learn it from this video.
Why all world maps are wrong: https://youtu.be/kIID5FDi2JQ
While it is generally OK to view these types of global map for daily usage, it can cause problems for large scale to global scale simulations.
In Earth science, GCS is most commonly used as the grid system for terrestrial ecosystem simulations. For example, a 1* 1 degree grid will discrete the global into a 360 * 180 matrix.
However, it will be problematic for several reasons. For example, the area at different regions are not the same. For example. a 0.5* 0.5 grid cell is about 5050km in Amazon whereas it is about 5025km in Alaska, only half the size of the former one.
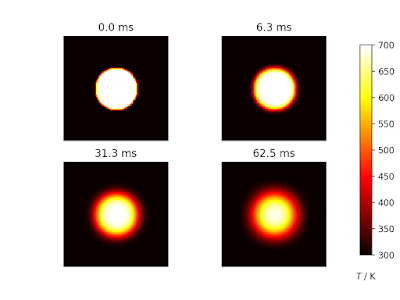
To illustrate the difference, let’s use a classical 2D heat equation I found from here: First, we run the simulation with the uniformly dx = dy, which present longitude and latitude in our case. The results are like this:
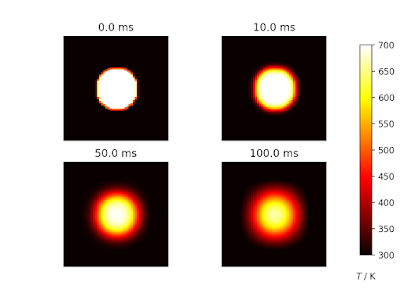
Then we changed to dy = 2 dx:
Last, we changed to dx = 2 dy:
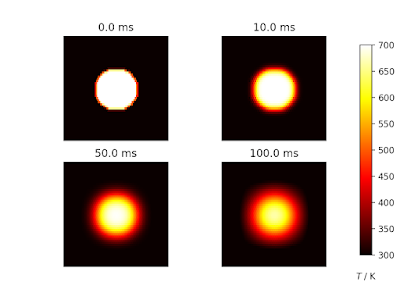
If you look closer, you will see the differences. When the grid geometry is not uniform, the simulated heat distribution is also not uniform in spatial.
Now let’s get back to GCS in global simulation. Because the grid geometry changes from tropic to pole regions, the simulations are likely affected as well.
Next, I will show you some results of global scale hydrologic simulation.