Evaluate the stream networks from watershed delineation
Recently I asked a question on the GIS Exchange site: https://gis.stackexchange.com/questions/315910/quantitatively-evaluating-quality-of-watershed-delineation-stream-line-results
I also asked the question on Research Gate: https://www.researchgate.net/post/How_to_quantitatively_evaluate_the_quality_of_the_watershed_delineation_stream_line_results
The reason is that we have developed a watershed delineation model and we need to evaluate whether our model performs better or not than the previous method.
So we set out trying to find ways to evaluate the results. The first thing as a watershed hydrologist will usually do is to look at the stream segments. If they match up with actual stream lines then it means the model is not bad.
However, both our method and the previous method can produce similar stream segment results. The the question is how can we say which one is better than the other one.

So we did some research online, and most publications used visual results as proof. Basically, we literally “see” the differences between different models.
Then there are also a few papers include slope, length for comparison, which still does not actually show which one is better effectively.
Among them, there is one paper proposed that by calculating distance between simulated stream and actual stream, we can determine how close the model is away from the truth. And I think this might be the closest we can find.
However, the idea of distance between two line vectors is not as intuitive as it looks.
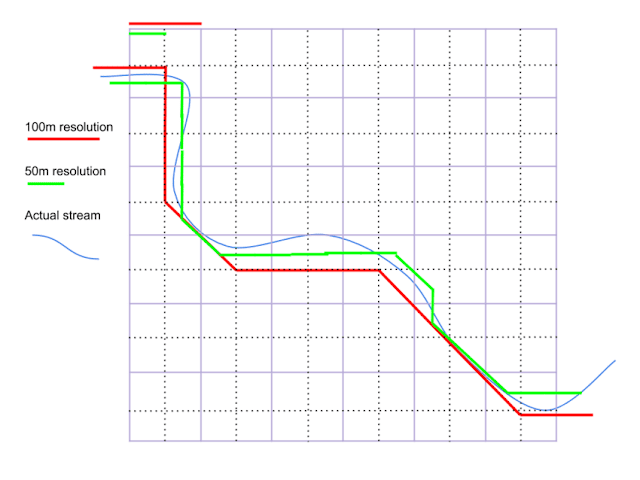
So we kept researching. Then we realized that if we place two stream line vectors together, we can get a polygon created by them. And if the two vectors are very close, then the area of the polygon should be small. This is illustrated by the figure:
Figure 1. The stream line vector with the true stream lines.
The new question becomes: How can we calculate the area of this “intersected area”? There is no existing tool can do this task in GIS. Because we are intersecting polylines and we need to create multiple polygons. It would be possible if we have the mathematical formula of each line and the locations of each intersection. By any means, it is a challenge in precise GIS.
So instead of thinking in the vector domain, we decided to try the raster domain. Luckily, we can easily convert these vectors into raster and do raster calculation. TLDR, the new question is similar to calculating the area of a closed domain.
And there are several related questions. For example this one: https://stackoverflow.com/questions/21816562/finding-holes-in-2d-point-sets
If you have ever used Photoshop, you probably have used the magic tool, which actually solves the problem we have here.
In one sentence, in order to calculate the area of the closed holes, we need to fill the rest of the raster. Since I did not use any advanced fill algorithm at the time of solving the problem, a brutal algorithm was used. Basically it fills the raster from boundary towards inside. And it took a long time to run.
Figure 2. The fill algorithm. The x-axis is step, and the y-axis the remaining pixel count.
Of course, if flood filling algorithm will significantly reduce the computational time. And the result shows that our method performs better under coarse resolution.
The take away message: I was surprised that a watershed delineation evaluation process will lead to flood filling algorithm, which is already used in the depression filling process!
For those who is not familiar with flood filling algorithm, here is more information: https://en.wikipedia.org/wiki/Flood_fill
Let me know if you have any question.